From a Microbiology Result to Antimicrobial Stewardship
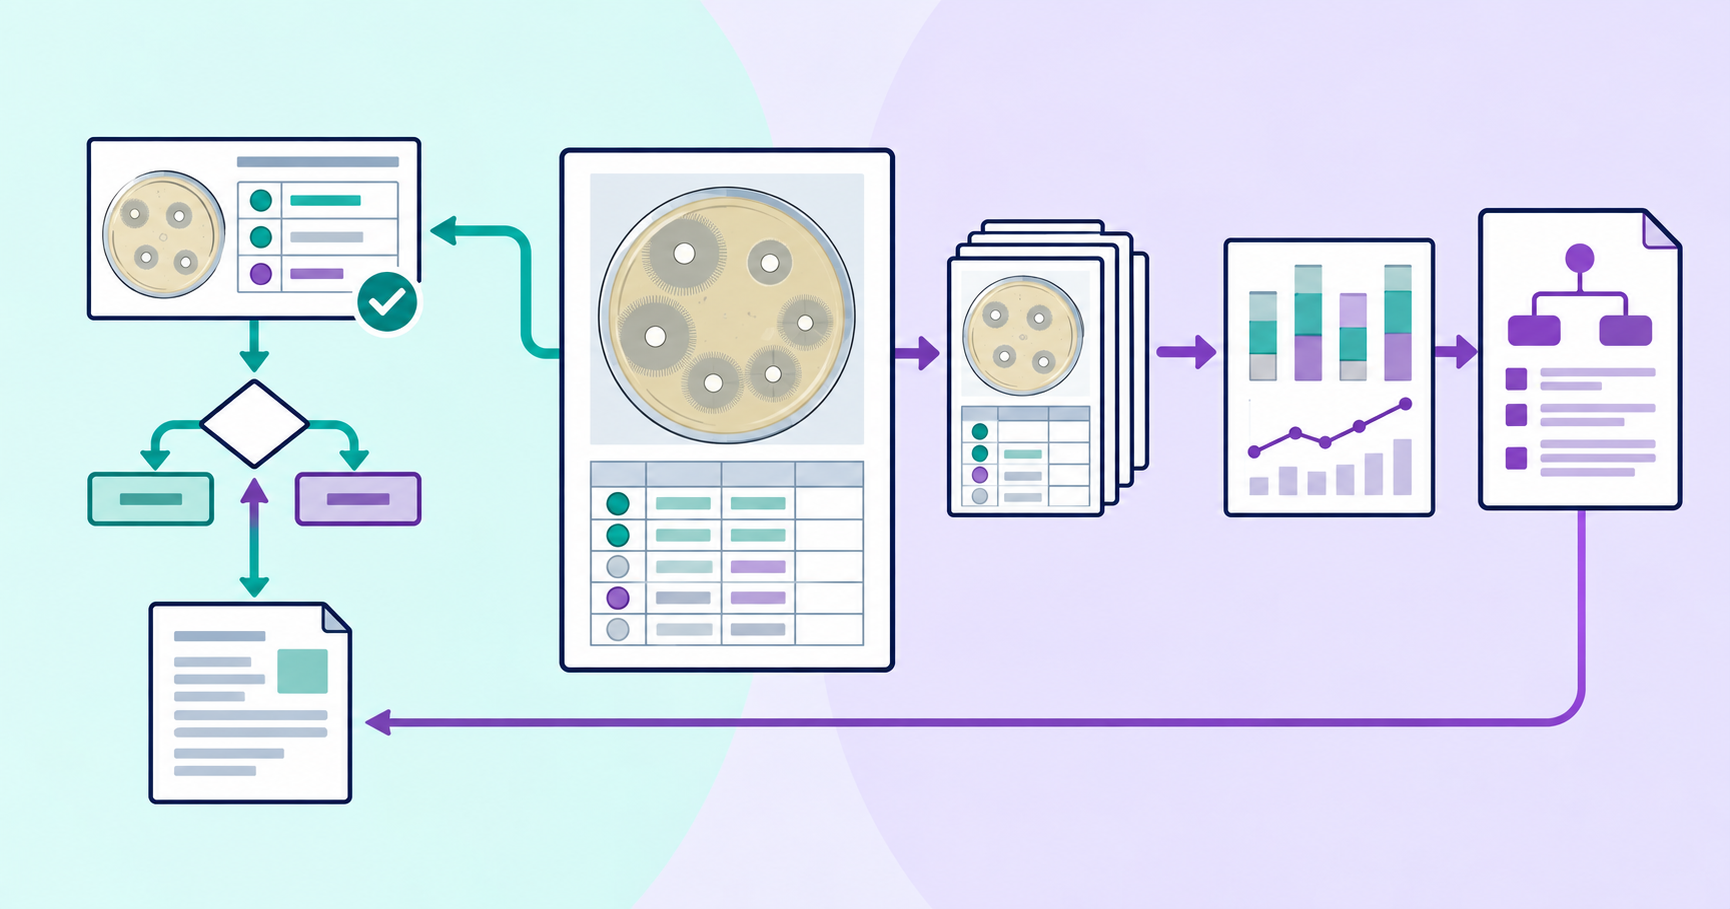
Table of Contents
ABioGram review and commentary. The publication by Holubar and colleagues discusses the knowledge and skills needed to organize and develop antimicrobial stewardship programs. Here, we examine its findings primarily through the lenses of clinical microbiology, data and decision-making. The system-development matrix below is ABioGram’s interpretation, based on the publication and our practical experience. It is neither a SHEA, IDSA, PIDS or SIDP classification nor a list of ABioGram product features.
Source document: publisher page · PDF
In 2026, the Society for Healthcare Epidemiology of America (SHEA), Infectious Diseases Society of America (IDSA), Pediatric Infectious Diseases Society (PIDS) and Society of Infectious Diseases Pharmacists (SIDP) published updated guidance on the knowledge and skills required of professionals involved in antimicrobial stewardship [1].
The document reaches well beyond drug selection or oversight of prescribing. The authors consider microbiological diagnosis, interpretation of results, antimicrobial use, data analysis, information technology, collaboration among specialists and outcome evaluation as parts of one system [1].
This supports a broader conclusion:
Antimicrobial stewardship starts neither with prescribing a drug nor with analyzing resistance. It starts with obtaining a clinically meaningful microbiology result and interpreting it correctly.
Individual test results then become the basis for analysis at the level of a unit, healthcare organization or region.
From testing to a treatment decision
The guidance gives considerable attention to questions that precede the choice of an antimicrobial agent.
The competencies identified by the authors include knowing when microbiological testing is indicated, choosing a method, collecting specimens correctly, interpreting culture and non-culture results, distinguishing infection from colonization and contamination, and using rapid diagnostics, molecular testing and whole-genome sequencing [1].
The decision pathway therefore begins well before asking which drug to prescribe:
Is testing needed → which clinical specimen should be collected → which method should be used → how reliable is the result → what does it mean in this clinical situation → should treatment change because of it?
An error at an early stage can affect every decision that follows.
For example, a laboratory result may be technically correct but of little clinical value if the specimen was collected without sufficient indication or does not represent the suspected infection site.
The quality of microbiological diagnosis and antimicrobial-use policy should therefore be considered together.
The microbiology report is part of the clinical workflow
The laboratory’s role does not end with identifying a microorganism and determining its susceptibility.
The guidance separately discusses interpreting culture and non-culture results, developing explanatory comments for clinicians, involving the laboratory in the choice of diagnostic approaches and collaborating with antimicrobial stewardship professionals [1].
This matters especially as the range of diagnostic technologies grows.
The same positive result may have different implications depending on the specimen, testing method, patient characteristics and suspected infection.
A microbiology result should therefore answer more than:
What was detected?
Within the laboratory’s area of expertise, it should also help answer:
How should this result be interpreted?
and:
What might it mean for subsequent diagnostic and treatment decisions?
A microbiology report is thus more than a way to transmit a laboratory finding. It is part of the clinical information workflow.
The laboratory becomes a participant in stewardship
The guidance gives collaboration with the clinical microbiology laboratory a distinct role.
It envisages two-way communication between the laboratory and professionals responsible for antimicrobial-use policy. At more advanced levels, the authors discuss regular joint reviews of problems, evaluation of diagnostic technologies and coordinated decisions about their adoption [1].
This differs substantially from a model in which the laboratory simply sends out test results.
The microbiology laboratory takes part in:
- developing diagnostic policy
- quality control of microbiological testing
- interpreting results
- antimicrobial resistance surveillance
- evaluating changes in susceptibility interpretation criteria
- developing local recommendations
- assessing the results of diagnostic and treatment interventions
This requires microbiological, clinical, pharmacological, epidemiological and analytical expertise to work together.
Two levels of microbiological data use
In practice, two connected levels should be distinguished.
flowchart TB
    A["Antimicrobial susceptibility result"]
    A --> P["For an individual patient"]
    A --> O["For the healthcare organization"]
    P --> B["Interpretation and microbiology report"] --> C["Treatment decision"]
    O --> D["Validated results"] --> E["Analysis of AMR and antimicrobial use"] --> F["Local guidance"]
    F -.-> C
    classDef clinical fill:#ecf9f8,stroke:#0d8c96,color:#182440,stroke-width:2px,font-size:20px
    classDef organizational fill:#f5f0ff,stroke:#7950c3,color:#182440,stroke-width:2px,font-size:20px
    class A,P,B,C clinical
    class O,D,E,F organizational
Individual test results form an organization’s shared data; local guidance then helps inform decisions for subsequent patients.
Individual patient level
The sequence is:
microbiological testing → susceptibility testing → interpretation → microbiology report → antimicrobial treatment decision.
At this level, the purpose of working with data is to support an appropriate decision in a particular clinical situation.
Healthcare organization level
As results accumulate, a different pathway emerges:
validated microbiology results → resistance analysis → analysis of antimicrobial use → identification of a problem → change in diagnostic or drug policy → outcome evaluation.
These levels should not be treated separately.
The quality of population-level analysis depends directly on the quality of each result included.
Conversely, accumulated organizational data can support local recommendations that influence decisions for individual patients.
There is therefore continuous feedback between individual and population levels.
Antibiogram and the Russian term antibiotikogramma: an important distinction
When reading international literature, a difference in terminology matters.
In the guidance, antibiogram mainly refers to cumulative microorganism susceptibility data, for example for a healthcare organization, unit or group of infections.
In Russian microbiology practice, antibiotikogramma usually refers to the antimicrobial susceptibility result for a particular isolate, as part of a microbiology report.
For population-level data, we therefore use:
- cumulative susceptibility report
- cumulative susceptibility analysis
- antimicrobial resistance report
The distinction has practical consequences.
An individual result informs a decision for a particular patient.
Cumulative measures characterize a defined set of observations and serve different purposes: analyzing local epidemiology, developing recommendations, evaluating antimicrobial-use policy and tracking resistance trends.
AMR surveillance is one component of the system
Cumulative susceptibility analysis remains an important part of antimicrobial stewardship.
The guidance proposes using it to track resistance, inform drug policy and develop clinical recommendations [1].
An organization-wide report, however, often cannot answer a specific practical question.
Differences may matter between:
- units
- specimen types
- observation periods
- patient groups
- microorganisms
- antimicrobial agents
- clinical situations
The authors therefore discuss more specialized cumulative analyses, including data for individual units and clinical syndromes [1].
There are limits to stratification.
As more analytical dimensions are introduced, the number of observations in each group falls and uncertainty increases.
The complexity of analysis should therefore be driven by the question being asked, rather than by the number of available filters.
Data quality comes before surveillance
A cumulative measure is a derived value.
Before calculating it, one must decide which results enter the analysis and whether they are comparable.
The following are particularly important for assessing antimicrobial resistance:
- standardized microorganism names
- standardized antimicrobial agent names
- consistent specimen terminology
- criteria for including results
- rules for counting first and repeat isolates
- deduplication
- completeness of susceptibility testing
- testing methods used
- changes in susceptibility interpretation breakpoints
- changes in testing intensity across units
- sample size
For example, a change over time in the proportion of resistant isolates does not necessarily reflect a true change in resistance among circulating microorganisms.
It may be related to changes in patient case mix, test volume, isolate-selection criteria or interpretation rules.
An analytical system should show not only the measure itself but also exactly how it was calculated.
Reproducible calculation methods are at least as important as the visual presentation of results.
Resistance and antimicrobial use should be analyzed together
The guidance separately discusses measuring antimicrobial use, applying standardized indicators, comparing units and using those data to identify problems [1].
At a more advanced level, the authors give an example of comparing antimicrobial-use measures with microorganism susceptibility data when designing interventions [1].
Combining the two is essential.
Resistance analysis describes the microbiological situation, but on its own does not explain why that situation developed.
Analysis of antimicrobial use describes prescribing patterns but does not capture the microbiological changes taking place.
Joint analysis makes it possible to ask more meaningful questions:
Does resistance change alongside the pattern of antimicrobial use?
Are trends the same in different units?
Which agents or drug classes account for most antimicrobial use?
Is a change in local recommendations accompanied by a change in prescribing patterns?
What happens to microbiological and clinical outcomes after an intervention?
A statistical association between antimicrobial use and resistance is not, by itself, proof of causation.
Diagnostic practice, patient case mix, infection prevention, circulation of particular microbial clones and other factors must also be considered.
From data to intervention
Having many indicators does not mean that an antimicrobial stewardship system is in place.
The central question is what happens after an analytical result is obtained.
The guidance envisages using data to find areas needing improvement, design interventions and evaluate their results [1].
This creates a closed loop:
measurement → identification of a problem → decision → change in practice → repeat measurement → outcome evaluation → policy adjustment.
An increase in use of a particular agent, for example, is initially only an observation.
It becomes useful for management when the team can determine:
- where the change occurred
- which prescriptions drove it
- whether they follow local recommendations
- which microbiological data need to be considered
- what intervention is possible
- whether indicators changed after the intervention
This distinguishes a reporting system from a management system.
Development matrix for an antimicrobial stewardship system
The guidance uses basic, intermediate and advanced levels to describe different knowledge, skills and organizational capabilities [1].
Building on that logic and our experience with microbiological data systems, we propose examining the development of antimicrobial stewardship across several areas at once.
This matrix is ABioGram’s own concept. It is not an accreditation scale, a formal assessment of a healthcare organization or a SHEA, IDSA, PIDS or SIDP classification.
| Area | Basic level | Developing level | Advanced level |
|---|---|---|---|
| Microbiological diagnosis | Basic rules for testing have been established | Indications, specimen quality and method selection are assessed | Diagnostic algorithms are embedded in clinical workflows |
| Interpretation and microbiology reporting | Results are interpreted using current criteria | Expert rules and interpretive comments are used | The microbiology result supports clinical decision-making |
| Data quality and standardization | Common reference terminology and data-presentation rules are used | Automated checks, deduplication and completeness controls are performed | Data provenance is traceable and several sources are integrated |
| AMR surveillance | Cumulative susceptibility and resistance are assessed | Trends and differences between units, specimens and observation groups are analyzed | Specialized analyses address specific clinical and management questions |
| Antimicrobial use | Overall volume and patterns of use are assessed | Analysis covers units, individual agents and drug classes | Use is analyzed together with resistance, clinical context and outcomes |
| Antimicrobial-use policy | Local recommendations exist | Recommendations are updated using local data | A continuous cycle of analysis, intervention and reassessment operates |
| Outcome evaluation | Process measures are used | Microbiological and clinical outcomes are assessed | Clinical, resource and economic consequences are analyzed |
| Digital support | Structured data are available | Information systems are integrated and interactive analytics are used | Decision support, predictive methods and automated workflows are applied |
A key advantage of this approach is that it does not require assigning an entire healthcare organization to one level.
Different components can develop at different speeds.
For example, an organization may have a capable microbiology laboratory and high-quality source data but limited ability to analyze antimicrobial use.
The reverse is also possible: interactive analytics may be available while rules for counting repeat isolates or standardizing data remain insufficiently formalized.
The matrix is therefore not intended to produce a single composite score.
Its purpose is to show which components are already in place, which limit further development and where the next step is needed.
Interactive analytics should serve a question
The guidance includes interactive dashboards among advanced capabilities for analyzing antimicrobial use by organization, unit, service, agent and other characteristics [1].
Many charts alone do not make a system analytical.
Useful analytics should help answer a sequence of questions:
What is happening?
Where is the change occurring?
How reliably has it been measured?
What factors might explain it?
Is an intervention needed?
Once practice changes, another question follows:
Did the intervention achieve the intended result?
An analytical system should therefore be designed around clinical and management questions, rather than the choice of charts.
A single indicator is rarely sufficient
The percentage of susceptible or resistant isolates is a convenient measure, but it rarely supports a sound conclusion on its own.
Interpretation should take into account:
- number of observations
- sample-selection rules
- statistical uncertainty
- absolute number of resistant isolates
- mix of clinical specimens
- differences between units
- changes in testing intensity
- changes in interpretation criteria
- trends in use of the relevant antimicrobial agents
The more consequential the planned management decision, the more important it is to use complementary measures and test alternative explanations for an observed change.
One data system, different users
Different specialists need the same underlying data, but they ask different questions.
Microbiologists need to examine organism identification, susceptibility-testing results, unusual phenotypes, testing quality and the validity of source data.
Clinical pharmacologists need to understand antimicrobial use, its consistency with local recommendations, its relationship with resistance and opportunities to adjust therapy.
Epidemiologists need to analyze temporal and spatial changes, identify unusual resistance profiles and assess possible epidemiological links.
Clinicians need information that helps them interpret a particular microbiology result and make a treatment decision.
Healthcare organization leaders need to understand the scale of a problem, changes after an intervention, clinical outcomes and resource use.
There is therefore no universally “correct dashboard.”
It is more useful to have a shared data system with different analytical views that answer each user’s questions.
Outcomes must be assessed more broadly than changes in resistance
In the guidance, program evaluation is not limited to antimicrobial use or the proportion of resistant microorganisms.
The authors also consider duration of therapy, time to appropriate treatment, adverse events, length of stay, readmissions, mortality, antimicrobial drug costs and healthcare costs [1].
This distinction is fundamental.
Reducing use of a particular agent is not an end in itself if treatment outcomes worsen.
Likewise, fewer microbiological tests cannot automatically be considered an improvement if diagnostic quality declines.
The consequences of an intervention should therefore be assessed across several connected dimensions:
| Measure group | What is assessed |
|---|---|
| Process | Whether diagnostic or treatment practice changed |
| Microbiological | Whether the distribution of isolated microorganisms and their susceptibility changed |
| Antimicrobial use | Whether prescribing volume and patterns changed |
| Clinical | Whether time to appropriate therapy, treatment duration and patient outcomes changed |
| Resource | Whether use of drugs, tests, bed-days and other resources changed |
| Economic | The monetary consequences of observed changes |
Economic evaluation follows clinical and organizational evaluation
The guidance considers financial measures alongside patient-safety measures and clinical outcomes [1].
ABioGram’s practical experience suggests that economic evaluation is most informative when it is built after the clinical and organizational logic of an intervention has been defined.
For example, a change in microbiological diagnostics could potentially affect:
- time to an actionable result
- duration of empiric therapy
- use of broad-spectrum antimicrobial agents
- volume of additional diagnostic testing
- length of hospital stay
- demand for other resources
If this causal pathway is specified and the relevant effects can be estimated quantitatively, they can be included in a scenario-based economic model.
Practical examples are our model of economic losses from microbiological diagnostic errors and the regional YNAO case.
Results from individual models cannot automatically be applied to every healthcare organization.
Economic outcomes depend on the baseline situation, patient case mix, volume of care, resource costs, scale of the intervention and model assumptions.
Several concepts should also be distinguished.
Budgetary impact reflects an actual change in monetary expenditure.
Resource impact describes a change in the use of bed-days, laboratory tests, drugs or staff time.
Potential economic impact assigns a monetary value to a wider range of consequences under specified assumptions.
Releasing a resource does not always produce an equivalent reduction in the budget.
For example, reducing avoidable bed-days may increase access to inpatient care without proportionally reducing the organization’s expenditure.
An economic model should therefore be transparent about its baseline assumptions, data sources, uncertainty ranges and the contribution of individual components to the final estimate.
Where artificial intelligence fits
The 2026 guidance mentions machine learning, artificial intelligence and risk models among advanced tools that may support decisions for common infectious syndromes [1].
The stage at which these tools are introduced matters.
Before applying complex predictive methods, more fundamental tasks need to be addressed:
- ensure the quality of microbiological testing
- interpret results correctly
- standardize data
- define reproducible indicators
- organize analysis
- integrate analytical findings into a clinical or management workflow
- determine how the results of an intervention will be evaluated
AI does not replace high-quality microbiology or properly organized data.
The sequence is closer to:
high-quality microbiology result → standardized data → valid indicators → interpretable analytics → decision support → predictive methods.
ABioGram is more than software
ABioGram’s practical experience shows that a technology platform is only one component of a system.
Building such a system requires work on several levels at once:
- organize data acquisition from laboratory and medical information systems
- ensure correct interpretation of susceptibility-testing results
- harmonize reference terminology and counting rules
- define methods for calculating indicators
- control source-data quality
- develop analytical dimensions
- connect microbiological data with antimicrobial use
- define how information is presented to different specialists
- establish decision-support mechanisms
- assess the consequences of changes in clinical and diagnostic practice
The value of such systems therefore depends on more than software code.
It emerges at the intersection of clinical microbiology, epidemiology, clinical pharmacology, data analysis, information technology, health economics and healthcare organization.
Experience across these areas makes it possible to move from automating individual operations to building a system in which microbiological data inform decisions.
From a microbiology result to a stewardship system
The approach described here has two connected pathways.
Clinical pathway
testing → result → interpretation → microbiology report → treatment decision
Organizational pathway
accumulation of validated results → surveillance of AMR and antimicrobial use → analytical assessment → change in diagnostic or drug policy → outcome evaluation
The connection between them runs both ways.
Individual results form an organization’s data.
Population-level analysis, in turn, supports local rules for diagnosis and antimicrobial use, which influence decisions for subsequent patients.
A modern antimicrobial stewardship system should therefore help answer a sequence of questions:
Was the microbiological test performed appropriately?
Was its result interpreted correctly?
How should this result affect the treatment decision?
What is happening to resistance and antimicrobial use across the healthcare organization?
Where are deviations or problems emerging?
How reliably have they been measured?
What can be changed in diagnostic or treatment practice?
What happened after the intervention?
How did the changes affect patients and resource use?
Within such a system, AMR surveillance remains important but is no longer the final goal. It is one stage in a broader sequence:
from a high-quality microbiology result to an informed clinical decision, from accumulated data to a change in practice, and from an intervention to a measurable assessment of its consequences.
References
- Holubar M, Bhowmick T, Buckel WR, Cosgrove SE, Evans C, File TM Jr, et al. Guidance for the Knowledge and Skills required for Antimicrobial Stewardship Leaders: an update from the Society for Healthcare Epidemiology of America, Infectious Diseases Society of America, Pediatric Infectious Diseases Society, and the Society of Infectious Diseases Pharmacists. Antimicrobial Stewardship & Healthcare Epidemiology. 2026;6:e130. doi:10.1017/ash.2026.10344.